Paper Cutouts
Using short “unplugged” activities with paper cutouts can be an effective way to introduce or explain graphics composition with PyTamaro.
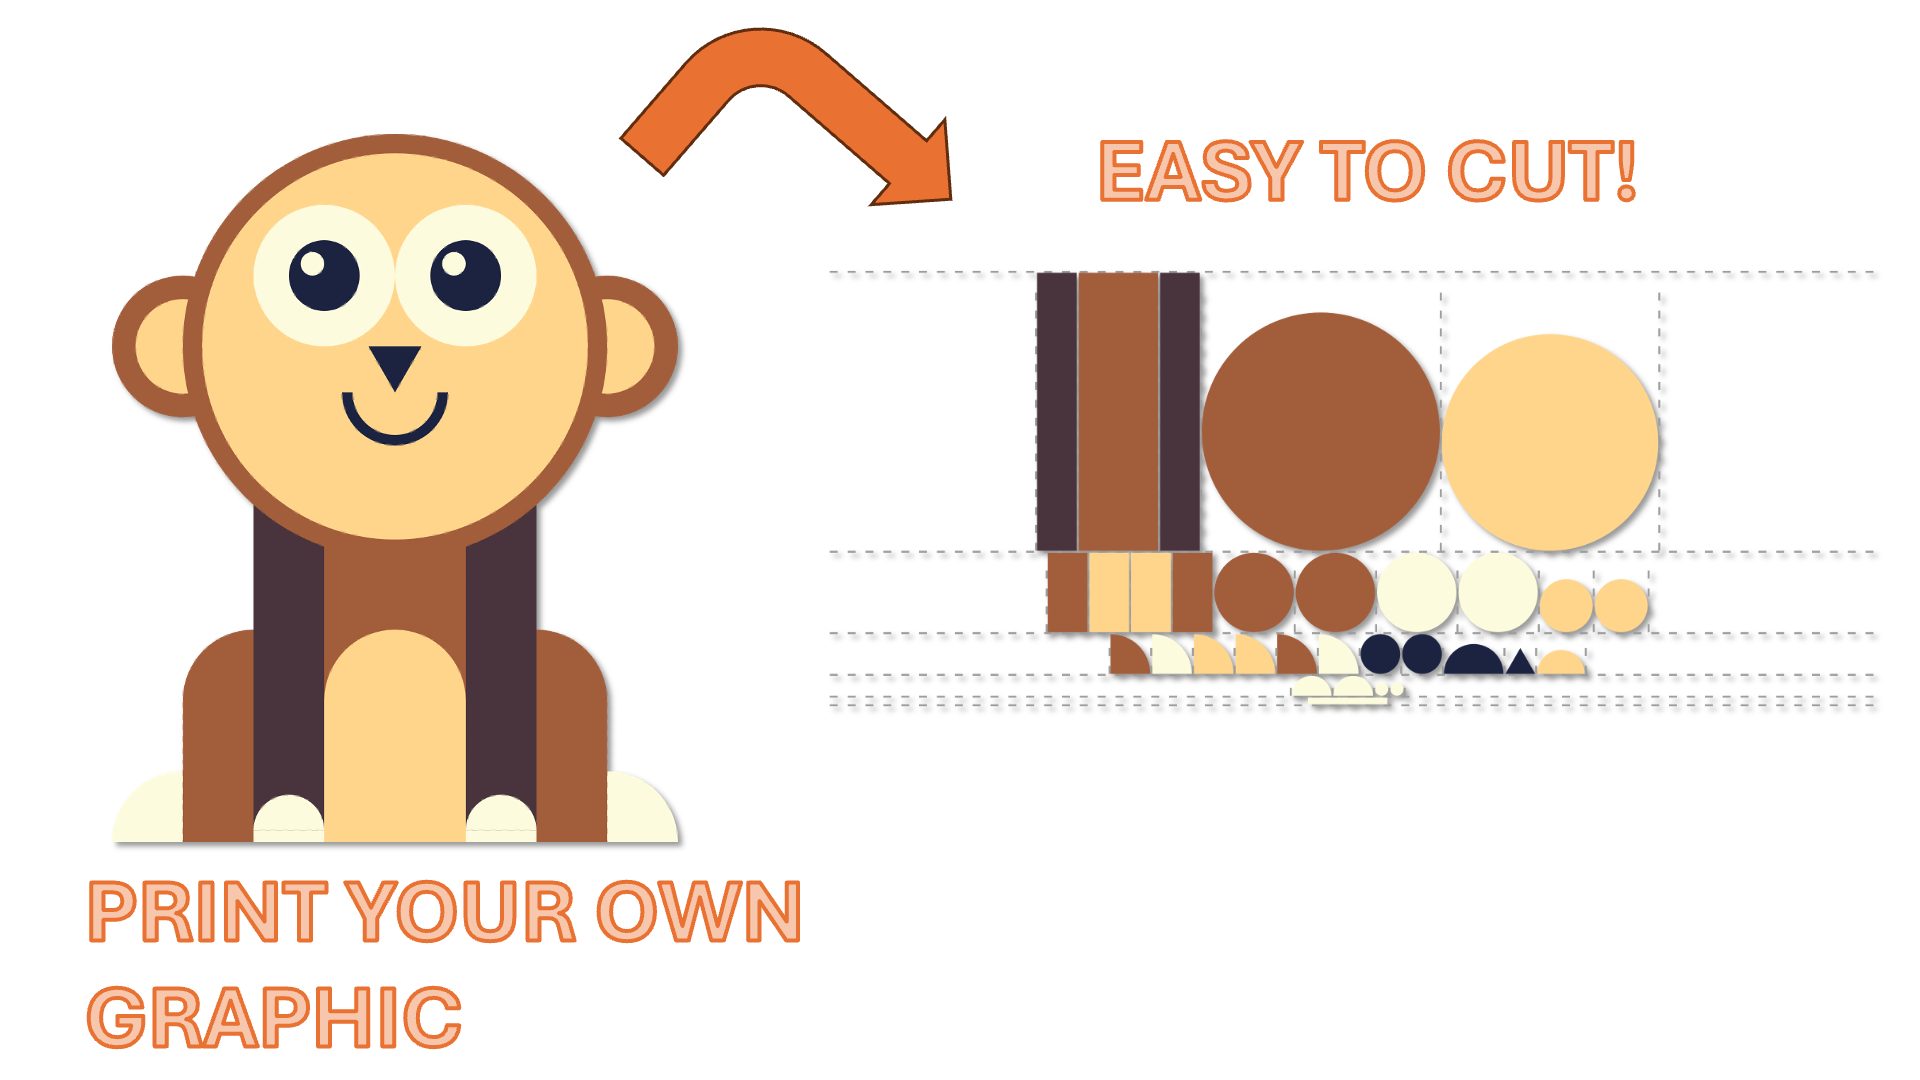
Here you can quickly produce all the paper pieces (rectangles, ellipses, triangles, ….) needed to construct any PyTamaro graphic!

The show_cutouts function available in this activty takes any graphic
and outputs one or more images with all the atomic pieces that are needed to compose the graphic,
ready to be printed and cut out.
And to reduce your effort of cutting them out, the pieces are cleverly arranged in the images.
Generate your graphic
💡 Tip: If you already implemented code to produce a graphic in some other activity on this site, work like a software engineer! How? Package the code in a function and
store the function in your toolbox. Then you can simply import your function from your toolbox here!
Output images of the cutouts
Now we get to the cool part! With a single function call you can automatically have your graphic decomposed, and all the atomic pieces spread out next to each other for easy printing.
Download, print, and cut
You still need to do some work. We can only generate the images. You have to print them, and you have to do all the cutting. Sorry!
Depending on your OS and browser, you may have to right-click on the image and pick "Save as...".
Be sure to print in landscape mode and make the image fill the entire page ("fit to page").
The pieces are placed in rows. If you have a paper cutter, you can first cut the page in rows. Then cut each row into columns. Then use scissors to cut whatever is still necessary.
Printing multiple copies
If you need multiple sets of cutouts (e.g., for multiple students),
you want to compose multiple copies of your graphic,
and call show_cutouts on the composite graphic.
This should reduce the usage of paper,
because it will pack pieces from multiple graphics onto the same page.
Paper Cutouts


PyTamaro is a project created by the Lugano Computing Education Research Lab at the Software Institute of USI
Privacy Policy • Platform Version ae799c9 (Mon, 16 Feb 2026 09:42:15 GMT)
