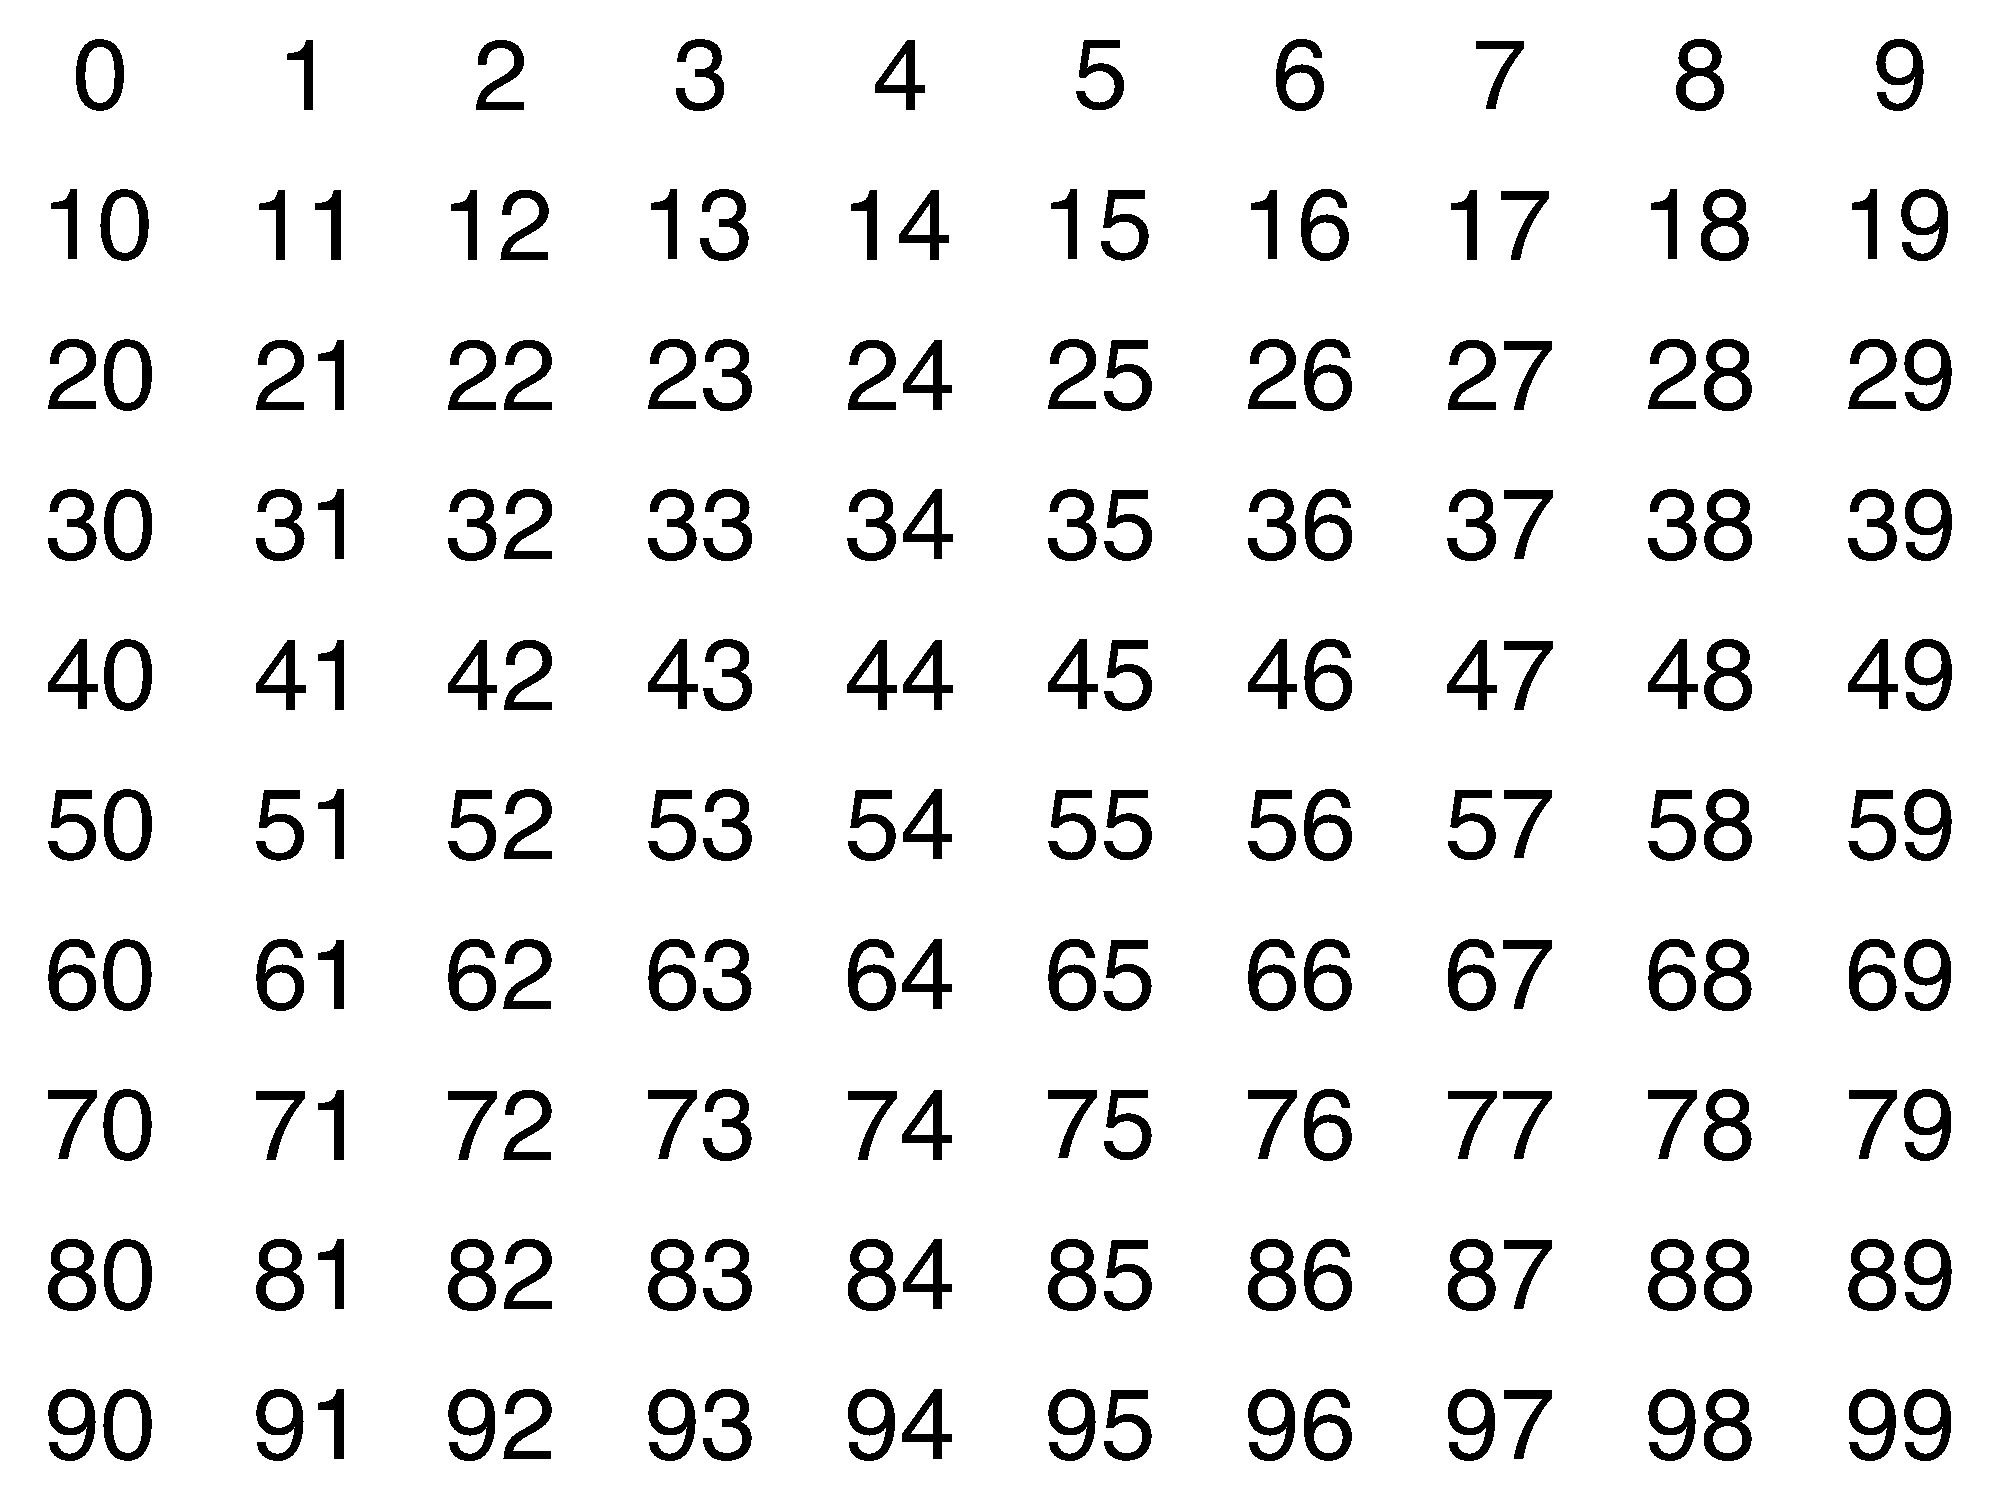
Number Grid
Let's display the first 100 natural numbers. We will arrange them in a grid so we can see some interesting patterns!
Decomposition
The grid consists of ten rows, and each row consists of 10 columns. Each cell of the grid contains a number.
The last digit, the ones, corresponds to the column number (assuming we number columns from 0 to 10). The first digit, the tens, corresponds to the row number (again, assuming we number rows from 0).
Given a column_number and a row_number, we can determine the value in that cell:
row_number * 10 + column_number * 1Implementation
Highlighting Multiples
Let's write a slightly more powerful function: one that creates a number grid and highlights certain numbers with a red background.
Specifically, we would like to highlight each number that is a multiple of a given value. For example, we could highlight all the multiples of 3 (0, 3, 6, 9, 12, 15, ...), which would look as follows:

To determine whether a given value is a multiple of some number
(is divisible by that number),
we can compute the remainder (value % number)
and then check whether the remainder is 0.
The multiples of 3 are 0, 3, 6, 9, 12, 15, 18, 21, 24, 27, 30, 33, 36, 39, ...
If we only look at the last digits of these numbers, we see a repeating pattern: 0, 3, 6, 9, 2, 5, 8, 1, 4, 7, 0, ...
This sequence of numbers looks somewhat arbitrary. However, when we look at our visualization, we see how this forms a pattern made of diagonal stripes across the number grid. This is because the last multiple of 3 under 10 is one less than 10, and so with every row we move down, we also move a column to the left.
Do you see the diagonal pattern?
Animation
Let's create an animation to highlight the multiples of 1, 2, 3, 4, ... 20. Each frame of the animation is a number grid with the multiples highlighted.
What You Learned
By programming your own number grid visualization
you practiced iterative computation,
using for-loops and using for-comprehensions.
You also used the modulo operator (%) to compute the remainder of a division.
On top of that you got to discover various regularities in the form of striped patterns in the number grid.
This activity has been created by LuCE Research Lab and is licensed under CC BY-SA 4.0.
Number Grid


PyTamaro is a project created by the Lugano Computing Education Research Lab at the Software Institute of USI
Privacy Policy • Platform Version 00e7fc6b (Tue, 28 Jul 2026 16:05:39 GMT)